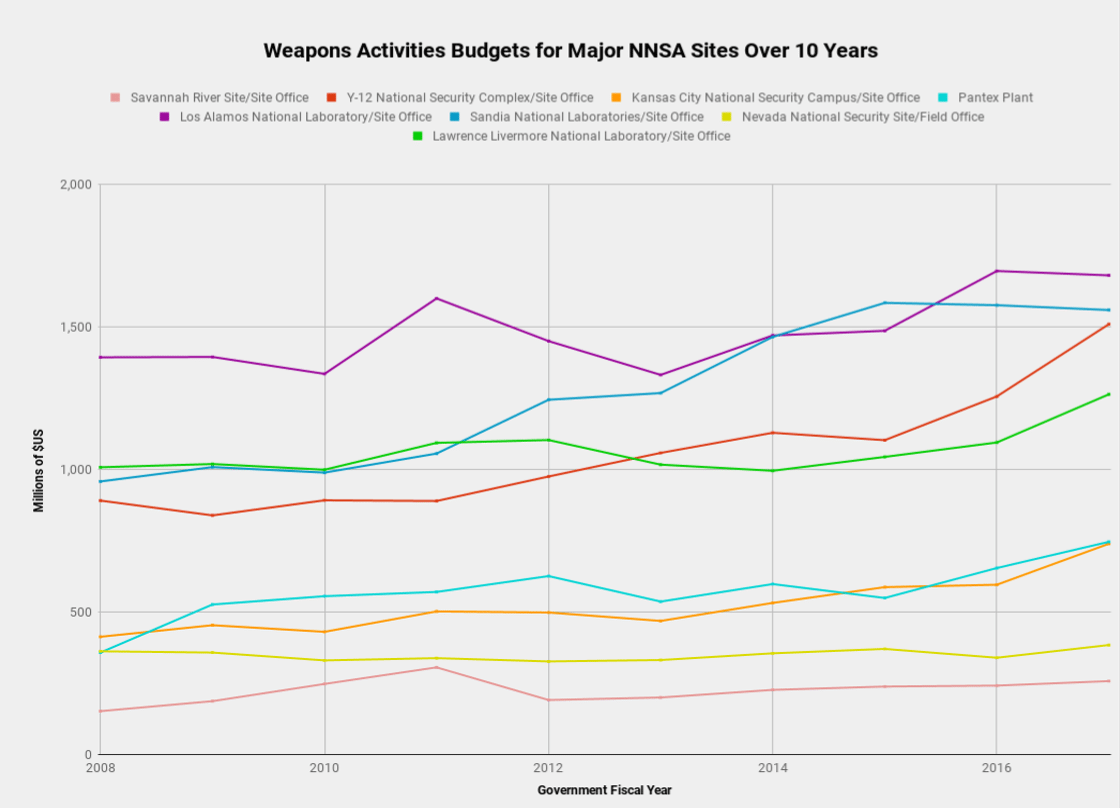
Laying out the annual weapons budget for some of the U.S. National Nuclear Security Administration’s (NNSA) major sites over the last decade yields little in the way of surprise: generally, the weapons budget is going up.
Source: DOE Congressional Budget Requests (Laboratory Tables).
Link: Interactive Version of Chart.
Figuratively speaking, these trends were written on the wall years ago, when the Barack Obama administration announced a three-decade nuclear deterrent modernization program on which NNSA and the Pentagon have been working ever since. Literally speaking, they were written in Department of Energy budget requests, which every year include tables breaking down how much the agency spends at its various facilities (not only those cataloged here).
If you prefer to absorb your data in alpha-numeric form (and there is nothing wrong with that) the table below spells out the spending trends captured in the graphic above.
| NNSA Weapons Activites Spending by Site (Millions of $US) | 2008 | 2009 | 2010 | 2011 | 2012 | 2013 | 2014 | 2015 | 2016 | 2017 | 2019 (Requested) |
| Savannah River Site/Site Office | 152 | 187 | 248 | 306 | 191 | 200 | 227 | 239 | 242 | 258 | 329 |
| Y-12 National Security Complex/Site Office | 891 | 839 | 892 | 889 | 975 | 1,058 | 1,129 | 1,103 | 1,256 | 1,509 | 1,714 |
| Kansas City National Security Campus/Site Office | 413 | 454 | 431 | 502 | 498 | 469 | 532 | 587 | 596 | 739 | 770 |
| Pantex Plant | 358 | 526 | 555 | 570 | 626 | 537 | 598 | 549 | 654 | 746 | 814 |
| Los Alamos National Laboratory/Site Office | 1,393 | 1,394 | 1,335 | 1,600 | 1,450 | 1,331 | 1,470 | 1,486 | 1,696 | 1,680 | 1,906 |
| Sandia National Laboratories/Site Office | 958 | 1,008 | 989 | 1,056 | 1,244 | 1,268 | 1,465 | 1,584 | 1,576 | 1,559 | 1,924 |
| Nevada National Security Site/Field Office | 362 | 358 | 330 | 338 | 327 | 332 | 355 | 371 | 340 | 384 | 358 |
| Lawrence Livermore National Laboratory/Site Office | 1,008 | 1,019 | 999 | 1,093 | 1,103 | 1,017 | 995 | 1,044 | 1,095 | 1,263 | 1,314 |
For the period 2008 through 2017 — the latest fiscal year for which complete, official Department of Energy data are available — the Livermore, Los Alamos, and Sandia weapons labs are perhaps unsurprisingly among the biggest spenders.
After 2011, when design work on the Uranium Processing Facility (UPF) began in earnest, the budget for the Y-12 National Security Complex and its companion NNSA field office surged.
The Pantex Plant in Amarillo, Texas, logged the largest increase — relative to itself, at least — in the latest decade for which data were available. That largely reflects four ongoing nuclear-warhead refurbishment programs (or three life-extension programs and one major alteration, if you prefer) that lean heavily on the only nuclear-weapon assembly facility in the nation.
These general trends will only continue, assuming Congress goes along with the White House plans for the Department of Energy nuclear enterprise.
The NNSA got more than $14.5 billion for fiscal 2018, under the omnibus spending bill President Donald Trump signed into law last month. In its 2019 budget request, the agency included a five-year budget projection that shows annual funding climbing more than 14 percent to around $17 billion by 2023.
